Module API
mpl_qt_viz
A Python package providing enhanced data visualization and ROI selection built on top of Matplotlib and PyQt5.
Subpackages
Useful classes for interacting with Matplotlib plots. |
|
Qt Widgets for interactive data visualization. |
Examples
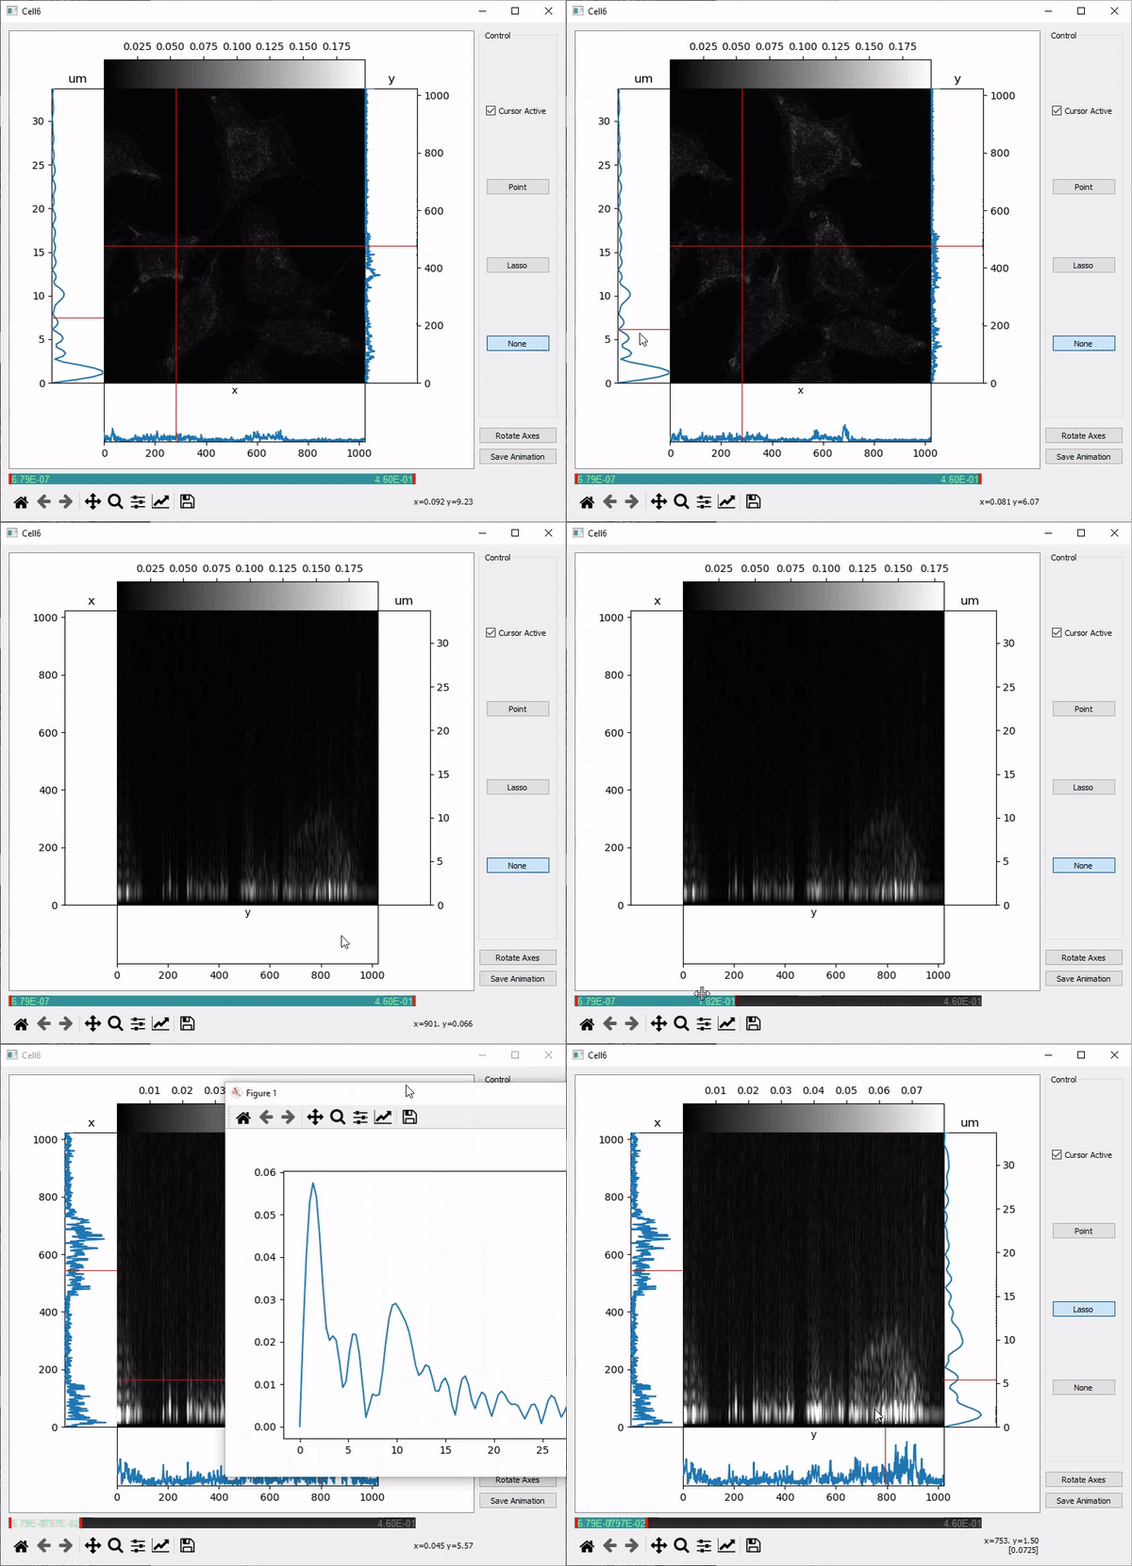
Using the PlotNd widget to visualize hyperspectral imagery of a cancer cell PlotNd widget to visualize hyperspectral imagery of a cancer cell.

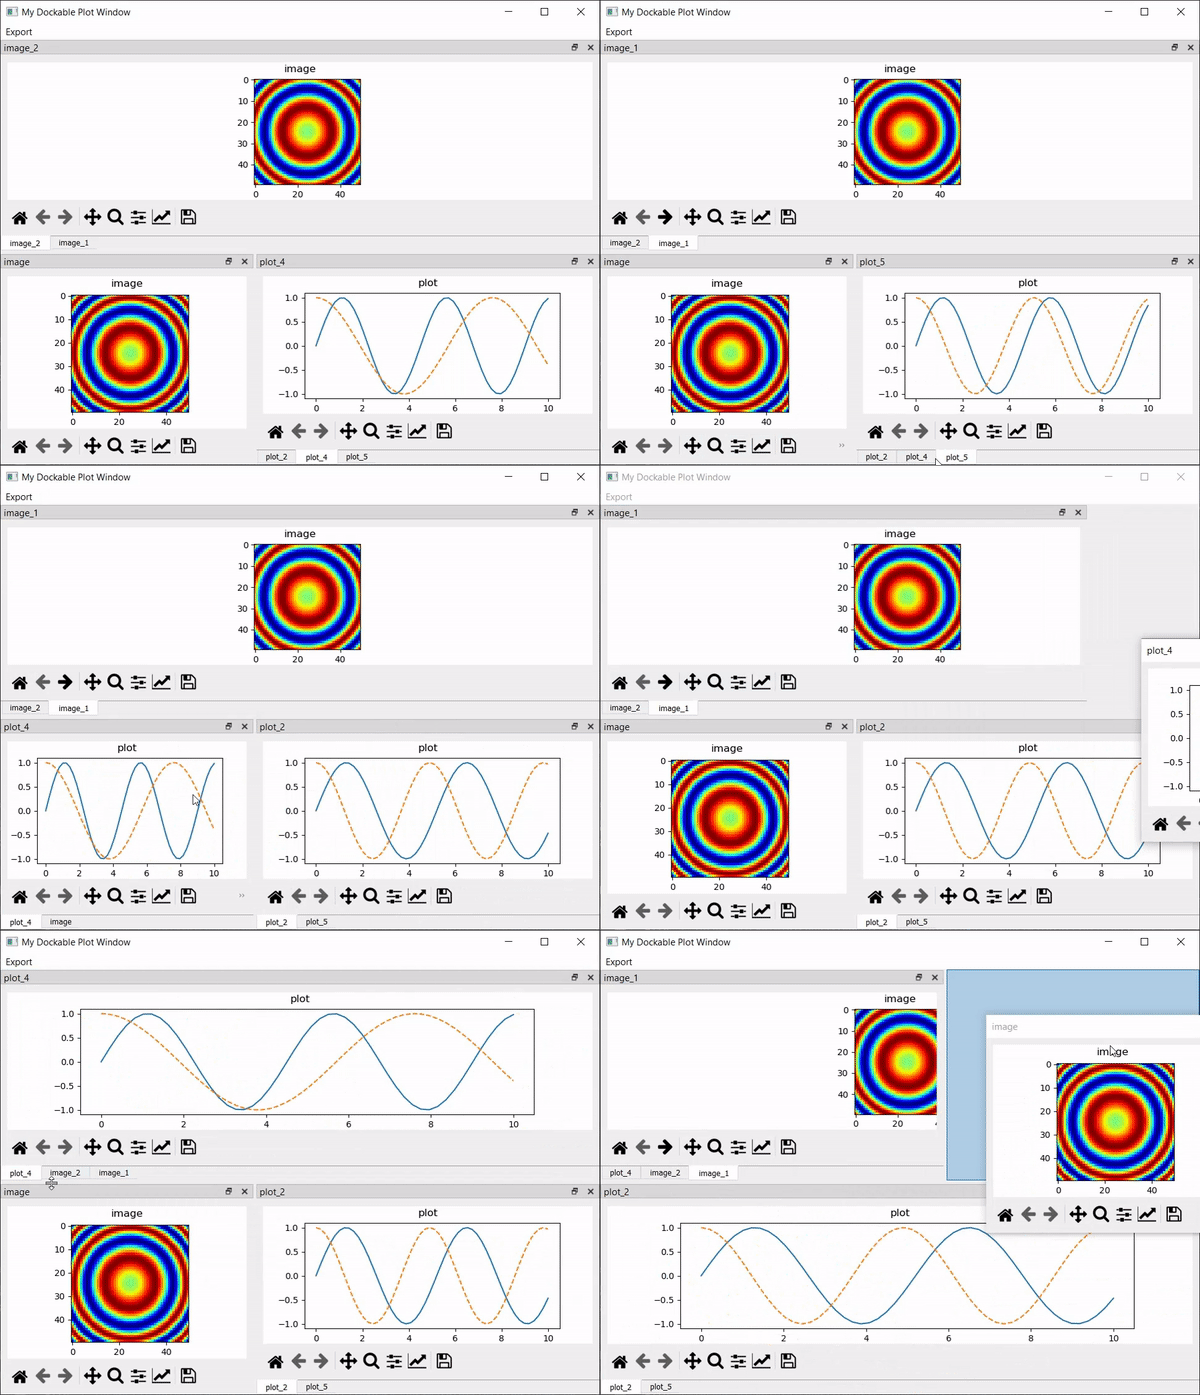
Using the DockablePlotsWindow to help organize a large number of plots.
